
Understanding Hampstead’s Housing Market Trends
December 4, 2025
December 4, 2025
Are you trying to make sense of what is happening in Hampstead’s housing market right now? With new construction popping up, coastal risks to consider, and headlines pulling you in every direction, it can feel hard to know when to act. You deserve a clear, local read on the numbers, plus simple rules you can actually use. In this guide, you’ll learn how to read the key metrics, what drives Hampstead demand and supply, how seasonality affects timing, and how to monitor trends like a pro. Let’s dive in.
Inventory is the number of homes actively for sale at a moment in time. On its own, inventory is a snapshot. To understand balance, compare it to recent monthly sales to estimate months of supply. In a small market like Hampstead, a single builder release can spike inventory, so look at trends over several months by price range and property type.
Days on market tracks how long it takes for a listing to go under contract. Shorter DOM signals stronger buyer demand. Use median DOM over 30-, 60-, and 90-day windows to smooth out odd listings, and be aware that relisted homes can reset the clock in some systems.
Median price is the middle sale price for a period. It is less affected by outliers than an average, which helps in a small, diverse market. Track quarter-over-quarter and year-over-year changes, and compare median sale price to median list price for pricing power. New-construction closings or a cluster of higher-end sales can temporarily push the median up.
Absorption shows the pace of sales relative to what is for sale. Calculate monthly absorption by dividing the last 30 days of closed sales by current active listings. Months of supply equals active listings divided by the average monthly closed sales. As a rule of thumb, under 3 months points to a seller’s market, 3 to 6 months looks balanced, and over 6 months favors buyers.
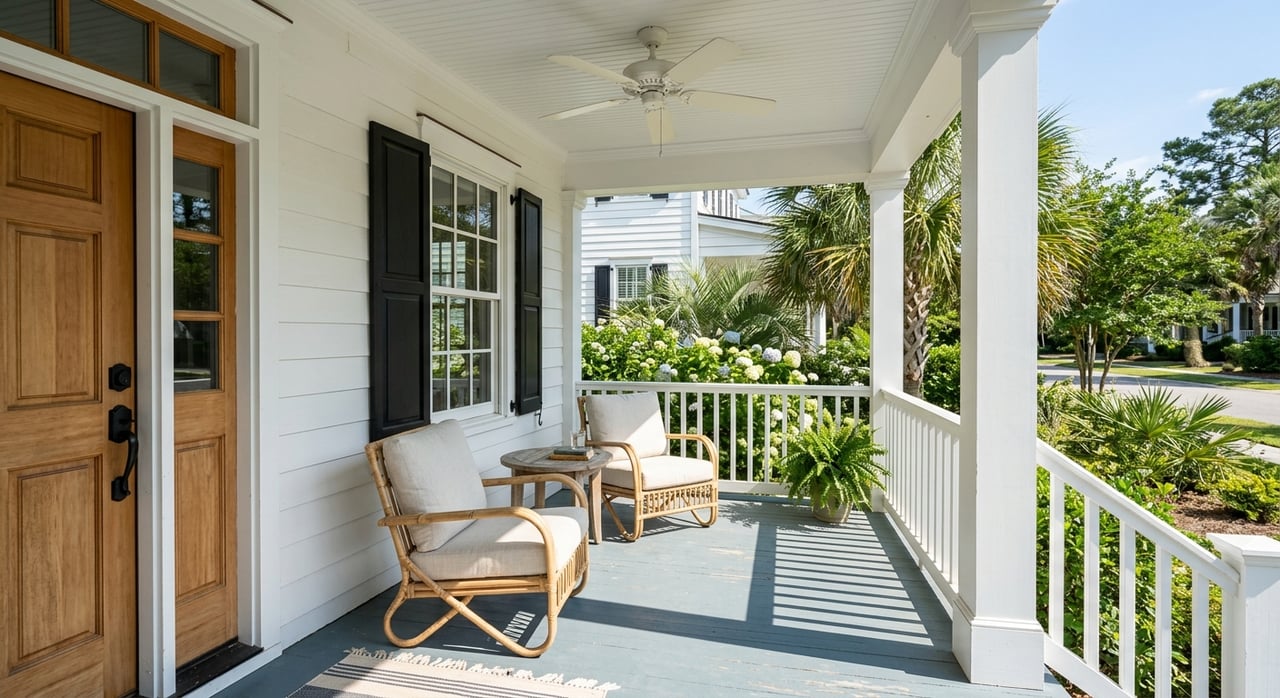
Hampstead sits along the US-17 corridor between Wilmington to the south and the Topsail-Onslow area to the north. Many buyers choose Hampstead for a coastal lifestyle, relative affordability compared to New Hanover County, and commute access. Military personnel, remote workers, and Wilmington commuters often anchor demand.
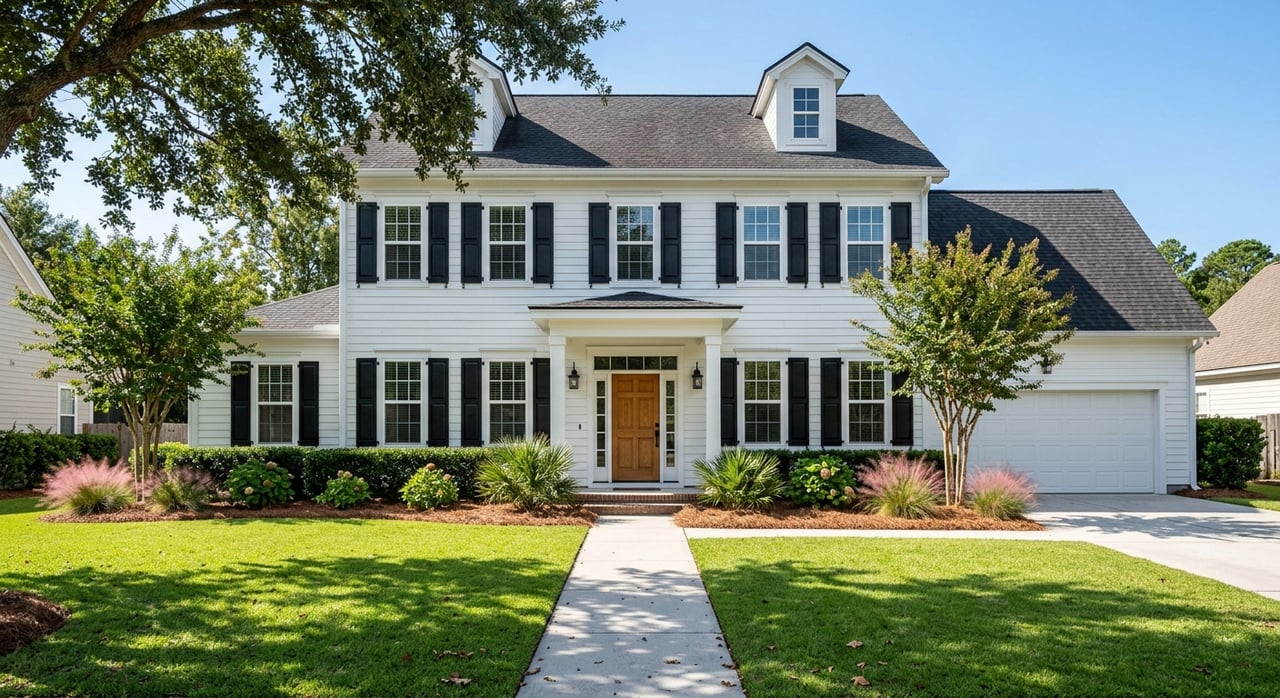
Pender County has grown as spillover from Wilmington continues. In Hampstead, that often shows up as new subdivisions and a higher share of new-construction closings. Builder releases can add dozens of listings at once, which may push inventory and days on market higher for a period before demand absorbs them.
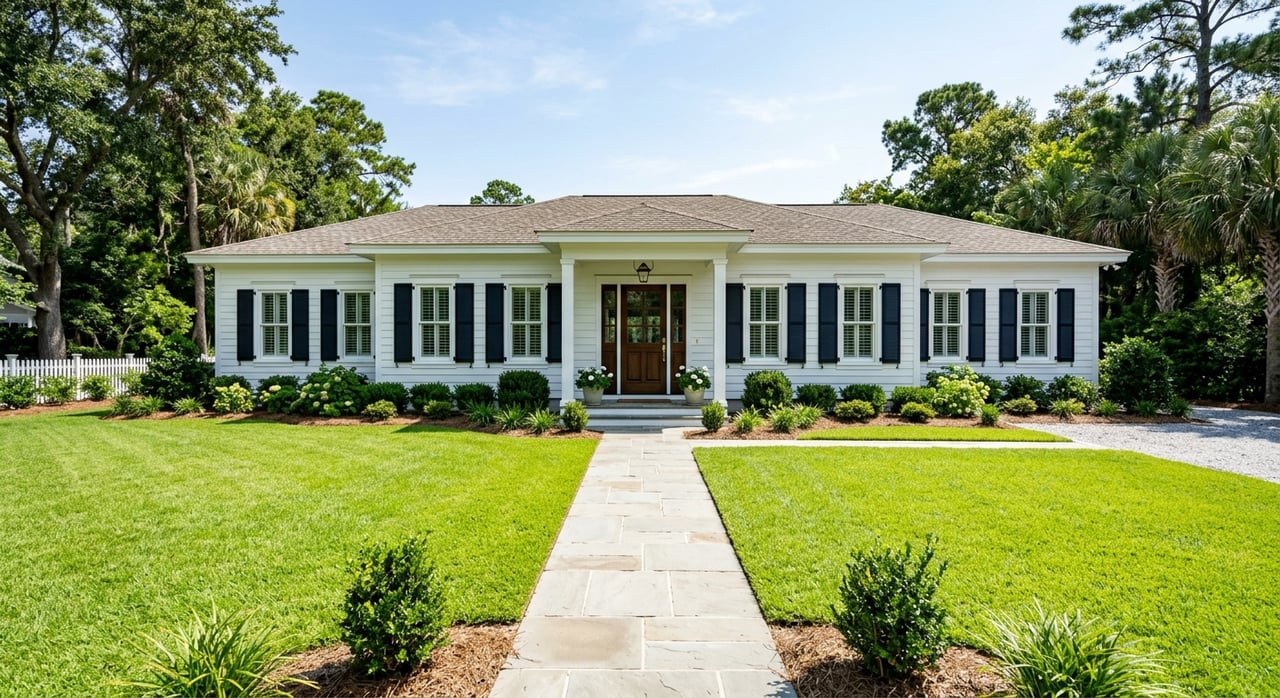
You will find a mix of single-family detached homes, new-construction communities with HOAs, waterfront or river-adjacent properties, and vacant lots. Financing, appraisal comps, and buyer expectations differ by product type, so segment your analysis by new build versus resale, and by inland versus waterfront.
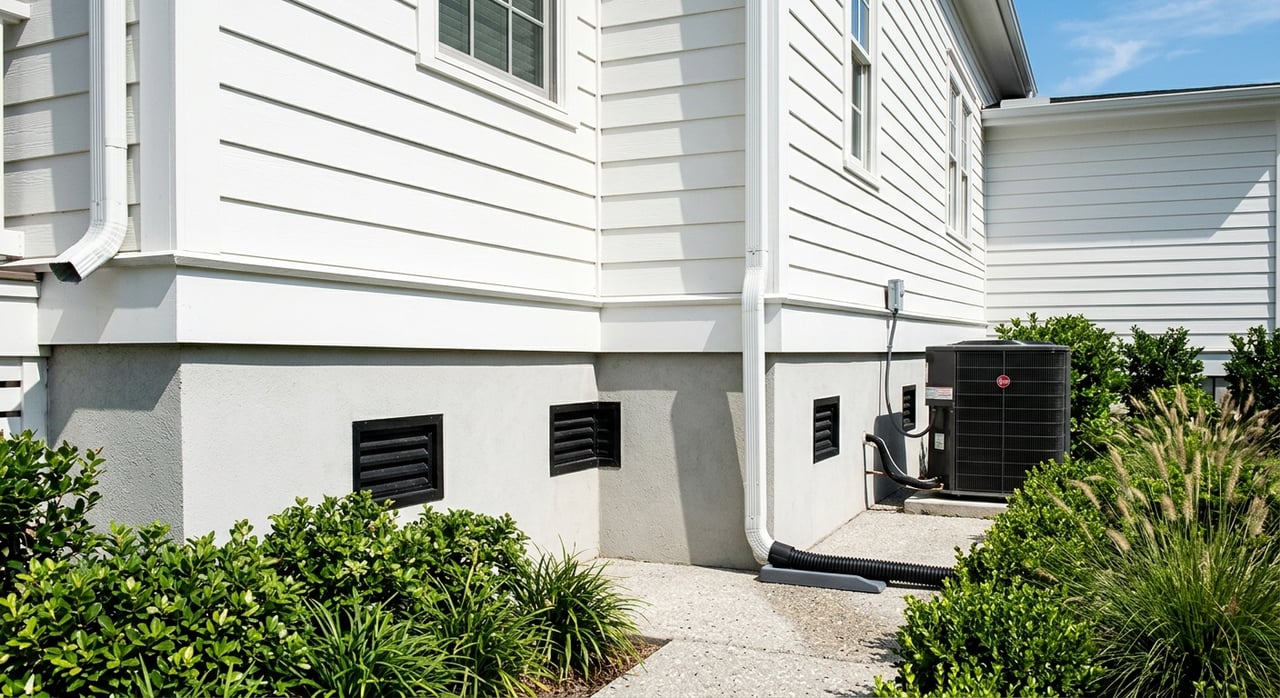
Coastal Pender County includes floodplain and wind exposure zones. Flood map designations and insurance costs can affect buyer demand and price acceptance for at-risk properties. Before you write an offer, verify flood zone status and obtain insurance quotes. As a seller, have elevation certificates and mitigation details ready if available.
Pender County Schools and community services can influence where family buyers focus. New school construction, rezoning, or improvements may shift demand across neighborhoods. If school timing matters to you, plan your move to align with the school-year calendar.
Road improvements, wastewater or sewer extensions, and zoning changes affect what can be built and how fast. Added infrastructure can unlock new subdivisions, while slower permitting can hold supply down. Keep an eye on county planning and permits to anticipate shifts in future inventory.
Hurricane season runs June through November with peak months in late summer and early fall, which can slow new listings or shift demand for homes with strong construction and mitigation features. Builders often list year-round as homes complete, so new-construction cycles may not follow the same seasonal pattern. Families often time closings to summer for school transitions.
If you want maximum exposure as a seller, late winter into early spring usually offers higher buyer traffic. If you are a buyer seeking leverage, late fall and winter or windows following large builder releases can bring longer DOM and more concessions. Stay flexible and watch your segment’s inventory trend, not just the overall market.
For the most accurate counts, use the regional MLS for active, pending, and closed sales. Public records from Pender County can confirm recorded sales and permits. County planning and building pages outline subdivision approvals and starts. Flood risk and insurance information is available through FEMA resources and the state insurance department. Statewide snapshots from North Carolina REALTORS can help you compare local moves to broader trends.
Use 3 to 6 month rolling averages, and compare Hampstead to Pender County and nearby New Hanover County to spot spillover effects. Segment by property type and location. Waterfront, new build, and resale inland segments can behave very differently in the same month.
You do not need to become a data analyst to make a smart move in Hampstead. You need clear metrics, local context, and a plan that fits your timing. With neighborhood-first expertise, modern tools like MLS-integrated search and instant valuations, and a negotiation-forward approach, you can move with confidence.
If you want a custom read on your price range or subdivision, let’s talk. You will get a simple dashboard of the metrics above, a forecast for your segment, and a practical plan for timing and terms. Connect with Holly Griffith LLC to schedule your free consultation.
Stay up to date on the latest real estate trends.


Buying, selling, or investing? Holly Griffith provides expert guidance, personalized service, and results that make a difference. Let’s turn your real estate goals into reality—contact Holly today!